Our model portfolio investment strategies strive to provide you with the same experience as every other account no matter the size or the tenure of your portfolio with us, all while giving you the individual treatment you deserve. Model portfolio investment strategies have many advantages:
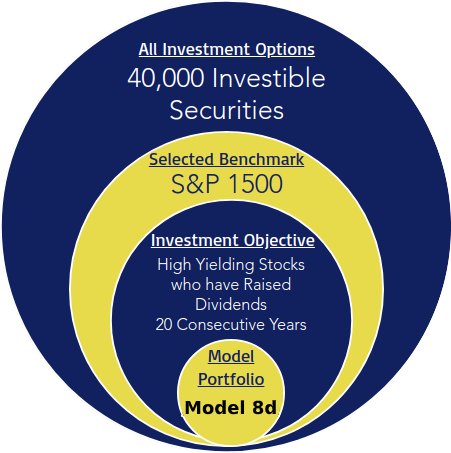
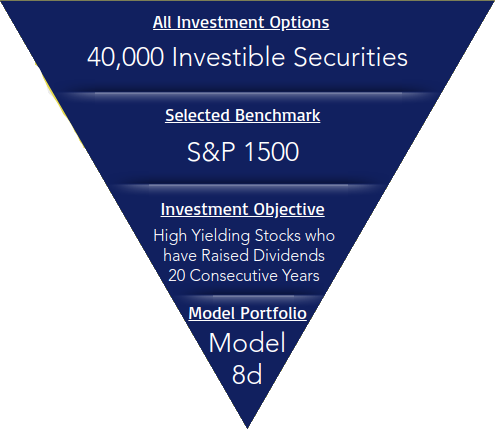
Our model portfolios are constructed from the top down. As part of the selection process, we begin by looking at all possible securities in the market. Next, we look at the highest-quality benchmarks to ensure we are selecting from the highest-quality pool of stocks possible.
From the selected benchmark, we focus on a particular investment objective. Once a pool of securities has been identified, we construct a model portfolio of holdings based on proprietary technical and fundamental analysis. Below are a few examples displaying this selection process.


We offer a selection of 24 model portfolios comprised of either ETFs or individual stocks that encompass a range of investment objectives as well as a range of risk profiles. By utilizing the model portfolios we are able to provide you the exact same time and price execution of trades as other clients within the same model.
These models allow our professional advisors to construct a unique portfolio curtailed to each clients’ investment profile. Although not all model portfolios are shown, below you will find our most popular strategies.
| Model 0 | Model 1 | Model 2 | Model 3 | Model 4 |
|---|---|---|---|---|
| Model 0 is comprised of ETFs with an equity target of 0%. | Model 1 is comprised of non-trade-fee ETFs with an equity target of 20%. | Model 2 is comprised of ETFs with an equity target of 30%. | Model 3 is comprised of non-trade-fee ETFs with an equity target of 40%. | Model 4 is comprised of ETFs with an equity target of 50%. |
| Model 5 | Model 6 | Model 7 | Model 8 | Model 9 |
|---|---|---|---|---|
| Model 5 is comprised of non-trade-fee ETFs with an equity target of 60%. | Model 6 is comprised of ETFs with an equity target of 70%. | Model 7 is comprised of non-trade-fee ETFs with an equity target of 80%. | Model 8 is comprised of ETFs with an equity target of 90%. | Model 9 is comprised of non-trade-fee ETFs with an equity target of 100%. |
| Model 8d | Model 6di | Model 8es |
|---|---|---|
| Dividend Growth | High Current Dividend Yield | Essential Services |
| A stock must: (1) be a member of the S&P Composite 1500 (2) Have increased dividends every year for at least 20 consecutive years (3) Meet minimum float-adjusted market capitalization and liquidity requirements. | A stock must satisfy the following criteria: (1) be a member of the S&P 500 and (2) must be actively traded. 50 stocks are selected from the 75 selected highest yielding stocks based on the lowest realized volatility. A stock must be high-yielding, qualified dividend-paying, and from U.S.-based securities screened for companies with superior quality and financial health. | All companies in the S&P 500 index that are classified as Utilities and Telecommunications. Companies such as water, gas and electric utilities, telecommunications, television and energy providers. |
| Model 10 | Model 12 |
|---|---|
| Growth | Aggressive Growth |
| Companies should be among the largest and more stable companies in the S&P 500 and must have listed options. Sector balance is considered in the selection of stocks. | A stock must be one of the largest non-financial companies listed on the Nasdaq Stock Market, based on market capitalization. |
The three volatility targeting models we offer (3VT, 6VT, 10VT) provide clients with multiple solutions to add a dynamic allocation to their portfolio. The models target a set annual standard deviation of returns through a dynamic exposure to an S&P 500 large cap index ETF. The models rebalance monthly and therefore generate trades on a monthly basis.
Below is a table that shows the backtest results of each model compared to the S&P 500 Index.
| Results of Backtest 2003 – 2019 | 3VT | 6VT | 10VT | S&P 500 Index |
|---|---|---|---|---|
| Target Volatility | 3% | 6% | 10% | |
| Backtest Volatility | 3.5% | 7% | 10.5% | 18% |
| Maximum Drawdown | -5.2% | -10.5% | -21.6% | -55.2% |
| Compounded Annual Growth Rate (CAGR) | 4.4% | 6.8% | 9.5% | 10.0% |
| Backtest Volatility vs. S&P 500 Index | 19% | 38% | 58% | 100% |
| Risk Adjusted Return (Higher is Better) | 126% | 97% | 84% | 51% |
| Average Allocation to S&P 500 Index ETF | 27% | 52% | 76% | 100% |
Volatility Targeting Strategy has long been offered by advanced hedge funds and large institutions. The team at Jackson Wealth Management takes great pride in offering this strategy to all of our clients.
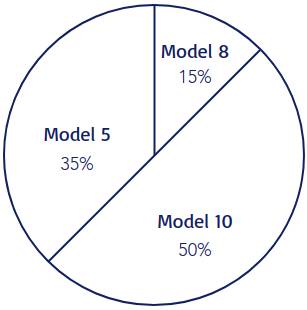
Learn More about VT Models and View DisclousuresEach clients portfolio consists of multiple accounts that are bought into different models allowing advisors to diversify each portfolio and build an overall allocation specific to each individuals risk profile.

Total equity exposure based on this sample portfolio of three accounts - 83%

If you have any questions or would like to discuss whether Jackson Wealth Management is right for you, we’d love to hear from you. Call or send us an email to schedule a no-obligation initial conversation.